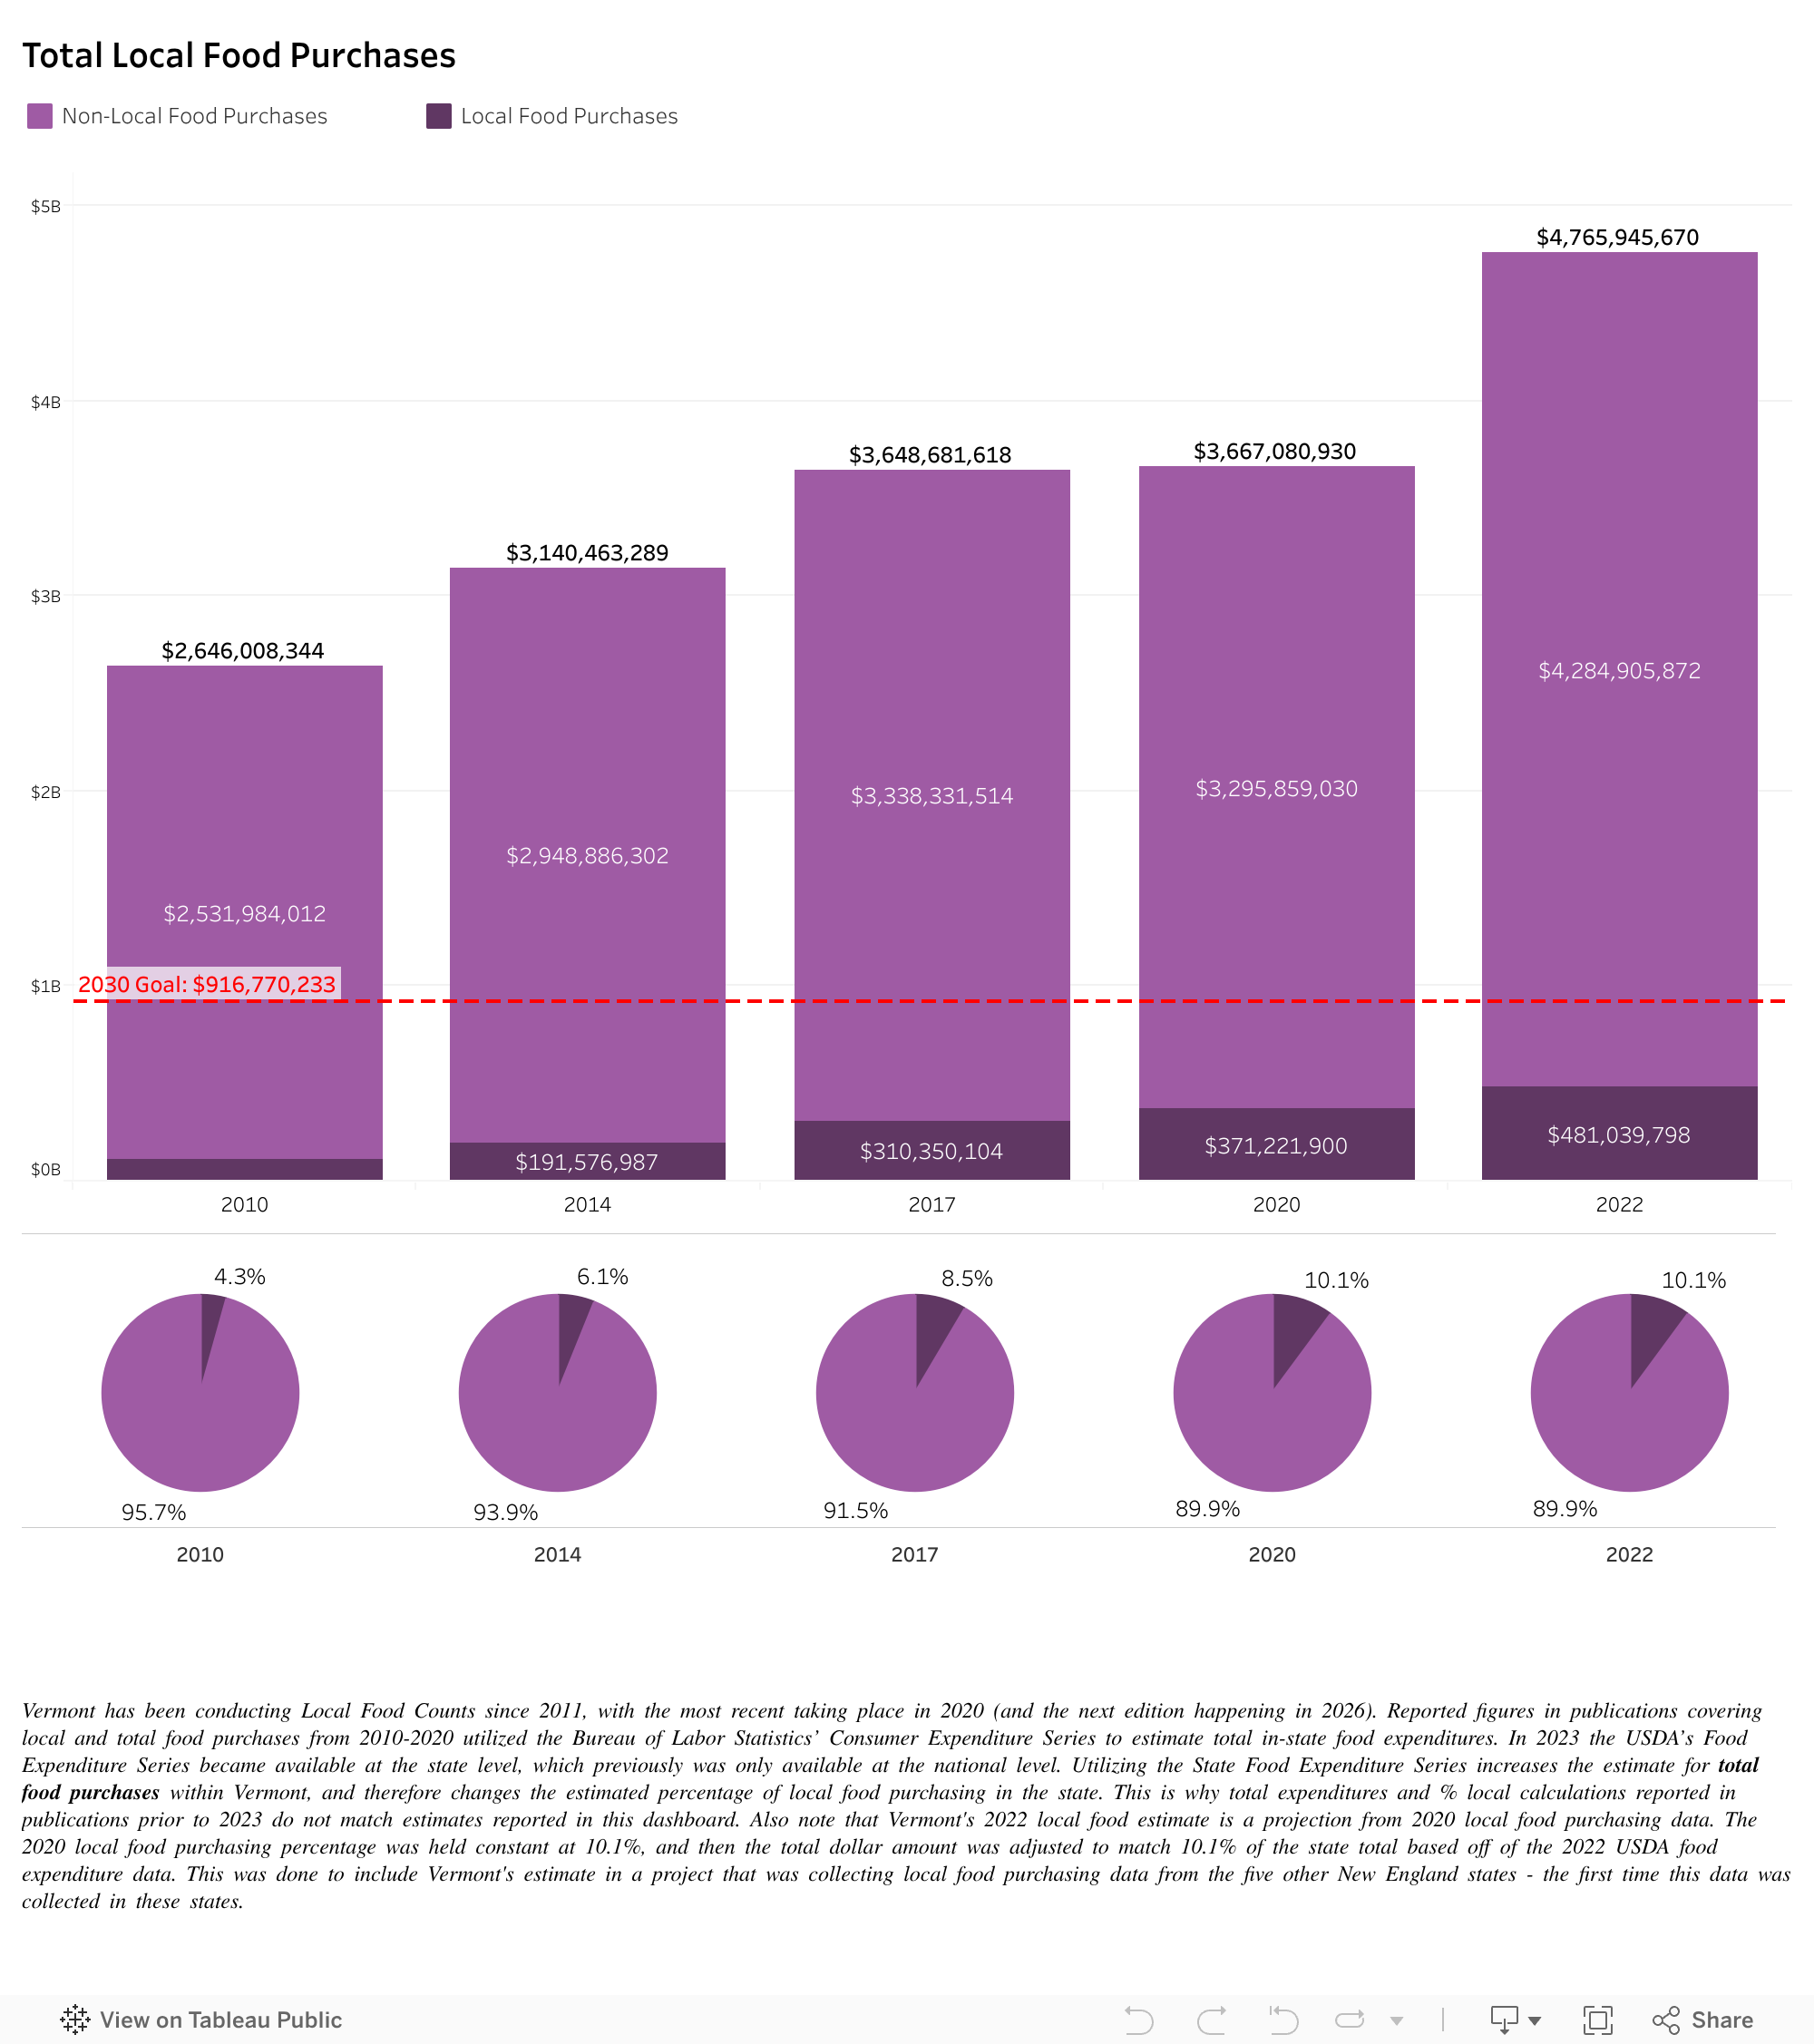
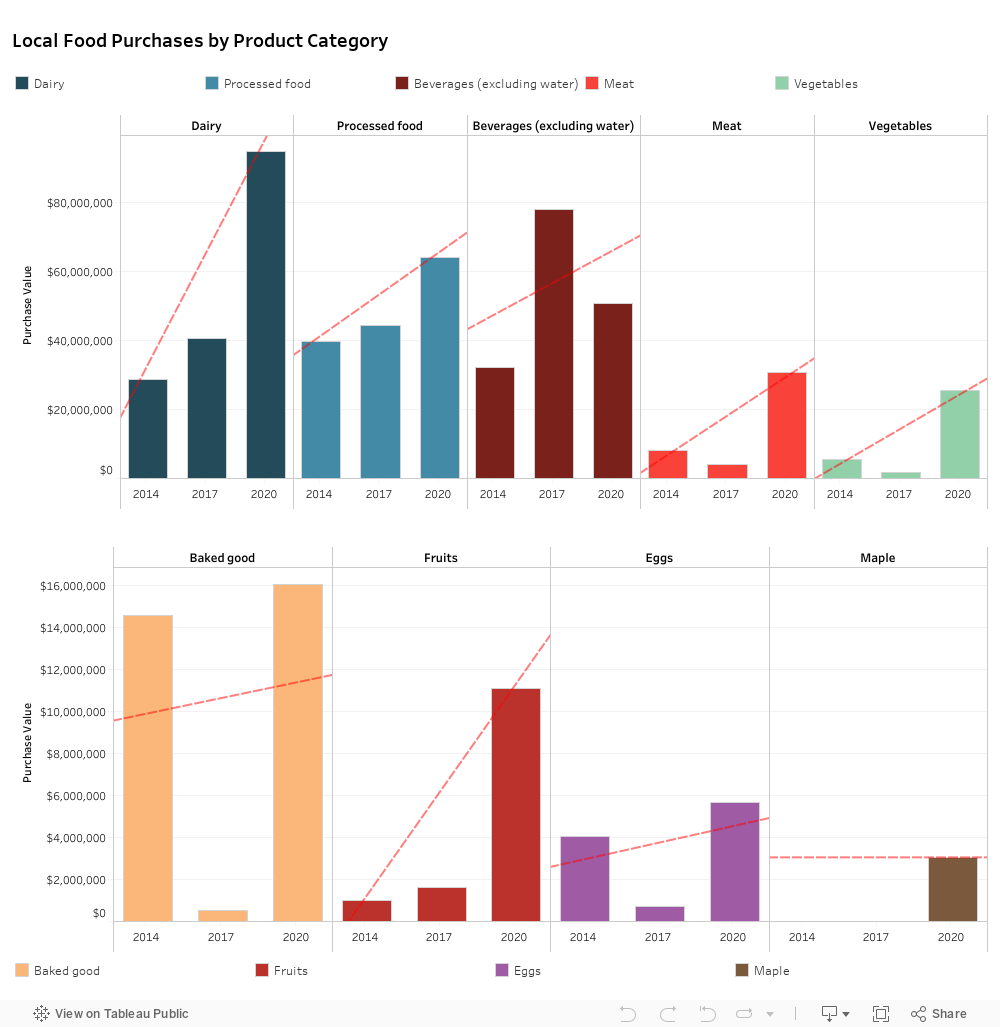
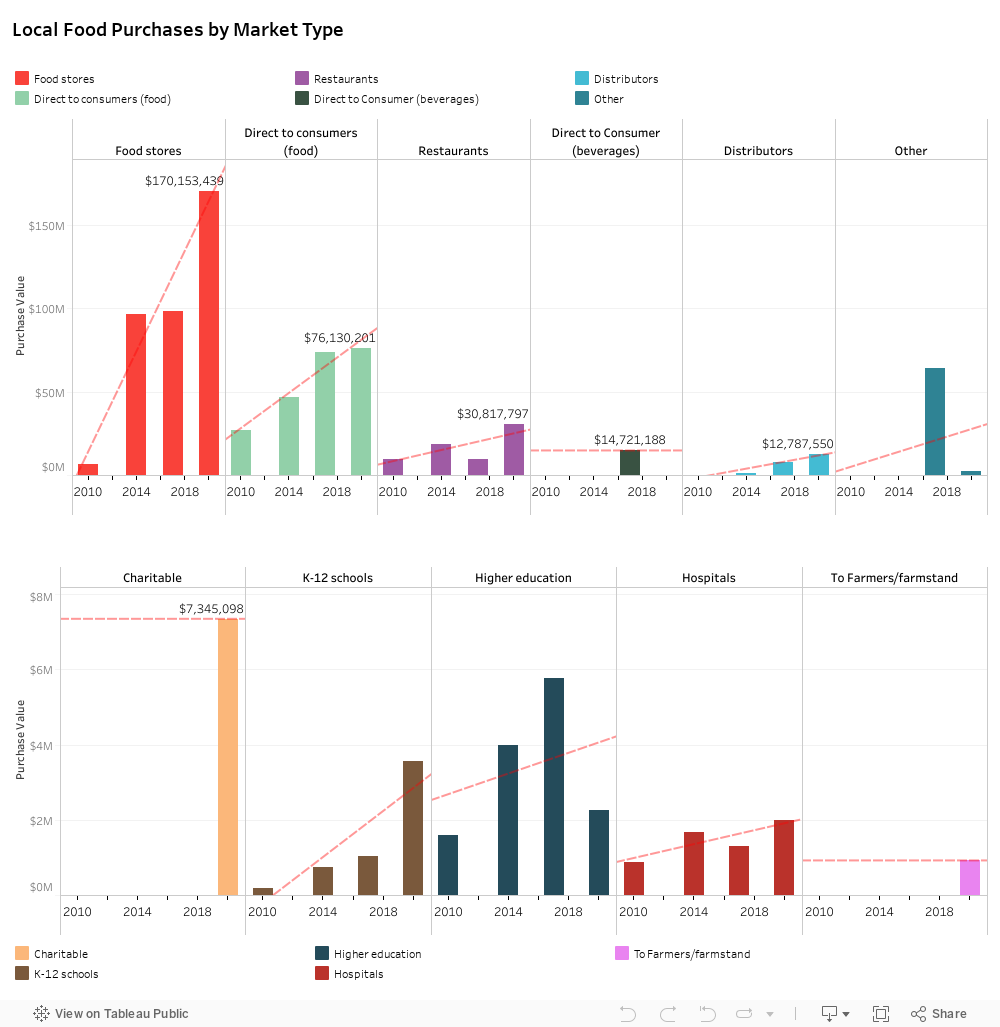
Chapter 2: Getting to 2020: Goals and Indicators

Goal 1: Consumption of Vermont-produced food by Vermonters and regional consumers will measurably increase.
Goal 1 encourages increased consumption of local and regional food products in order to increase the "farm share" of each food dollar going to farmers; to incentivize more local and regional food production; to increase local food access for all Vermonters and regional consumers; to protect the working landscape; maintain and build social capital; and encourage healthy eating habits.
Download Goal Data (XLSX 1MB)
Population Indicators
-Show Population Indicators Navigation- Total Local Food Sales in Vermont Increased from $114 million in 2010 to $310 million in 2017
- Value of Local Food Purchases by Category 2014-2017
- Value of Local Food Purchases by Destination 2014-2017
- National Restaurant Association Survey Shows that Local Sourcing Makes Up Most of Top Ten Culinary Trends from 2014 to 2017
- New England Direct Sales Increased from 1997 to 2012
- New England Direct Sales Increased as a Percent of Total Sales from 1997 to 2012
- The Number of Farms Selling Directly to Consumers and the Value of Direct Sales Increased Across Vermont Counties from 1997 to 2012
- Growth in Direct Sales Slowed from 2007 to 2012 Across Vermont
- New England Farm Income from Agritourism and Direct Sales Increased from 2007 to 2012
Population Indicators: Total Local Food Sales in Vermont Increased from $114 million in 2010 to $310 million in 2017
Population Indicators: Value of Local Food Purchases by Category 2014-2017
Population Indicators: Value of Local Food Purchases by Destination 2014-2017
Population Indicators: National Restaurant Association Survey Shows that Local Sourcing Makes Up Most of Top Ten Culinary Trends from 2014 to 2017
Population Indicators: New England Direct Sales Increased from 1997 to 2012
Population Indicators: New England Direct Sales Increased as a Percent of Total Sales from 1997 to 2012
Population Indicators: The Number of Farms Selling Directly to Consumers and the Value of Direct Sales Increased Across Vermont Counties from 1997 to 2012
Population Indicators: Growth in Direct Sales Slowed from 2007 to 2012 Across Vermont
Population Indicators: New England Farm Income from Agritourism and Direct Sales Increased from 2007 to 2012
Performance Measurement: Performance Measurements -Show Performance Measurements
Performance Measurements | Lead Organizations |
---|---|
Last Updated: May 10, 2013 Measure local food consumption. View Details » |
UVM Center for Sustainable Agriculture, UVM Community Development and Applied Economics (CDAE), Vermont Sustainable Jobs Fund |
Additional Indicators -Show Additional Indicators & Performance Measurements
Categories | Data Source |
---|---|
Direct Sales (2007) | Census of Agriculture, Table 2: Market Value of Agricultural Products Sold Including Landlord's Share and Direct Sales |
Vermont Food Service and Drinking Places Sales (2007) | Economic Census: NAICS Code 722 |
Vermont Retail Food and Beverage Sales (2007) | Economic Census: NAICS Code 445 |
Value of Food Shipments into Vermont (2007) |
Commodity Flow Survey |
Food Expenditures for Households by Quintile of Income |
Consumer Expenditure Survey |
Vermont Department of Taxes |
Statistics - Meals and Rooms Multiple Period Report |